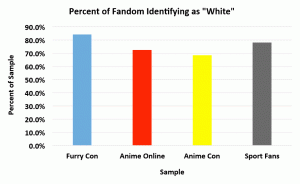
Across samples, the majority of furries have been consistently been found to self-identify as White, with approximately 15-20% of furries identifying as a member of an ethnic minority.1 One caveat should be noted, however: the majority of these studies were conducted at North American conventions or, when online, were conducted in English, which may account, at least in part, for these results.
Ethnicity of Furry Participants
| Ethnicity | % of Sample |
| White | 83.2 |
| Black | 2.1 |
| Asian | 2.0 |
| First Nations/Native American | 0.6 |
| Hispanic | 3.0 |
| Middle Eastern | 0.1 |
| East Indian | 3.1 |
| Other | 9.0 |
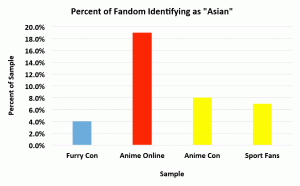
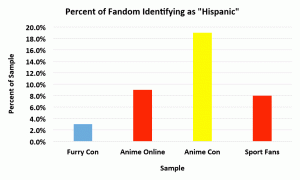
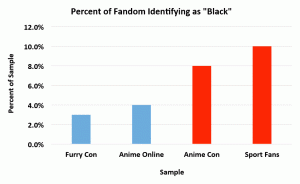
When compared to other fan groups, furries, as a group, were the most predominantly White (see figures below; color differences indicate significant statistical differences between groups.)2 The reasons for this are unknown, though it may be the case that the historical origins of the furry fandom (grounded in the science-fiction fandom which has also been traditionally White) may partially explain these findings. In comparison, convention-going anime fans had a significant Hispanic population, likely owing to the convention’s location in Dallas, Texas, a region with a large Hispanic population relative to other parts of the country. This is supported by the relatively smaller proportion of Hispanic participants in the online anime sample, which represents online participants from far more diverse regions. Interestingly, the online anime sample had significantly more Asian participants, something one would expect in a fandom centered on Japanese animation, although there were unexpectedly few Asian participants at the anime convention.


Pardon me, but I’m a little confused. When I add up the percentages for ethnicities at the top, I get 103.1%. Might I ask where this extra 3.1% has come from?
Great question! The percentages add up to more than 100% because people were allowed to check off more than one box on the question (specifically, we told them to “check all that apply”). So it would be entirely possible, for example, for a person to check “White” and “Hispanic”, or “Asian” and “Other”. As a result, the numbers get a little funky if you try to add them up to get a total percentage, because participants can fall into multiple categories.